
Debugger
The Debugger can be opened from the Properties Panel. The debugger will open on the top of the current page and should leave enough room for the extension to be visible. The Debugger also leaves the Edit Mode to make enough room for interacting with the extension.
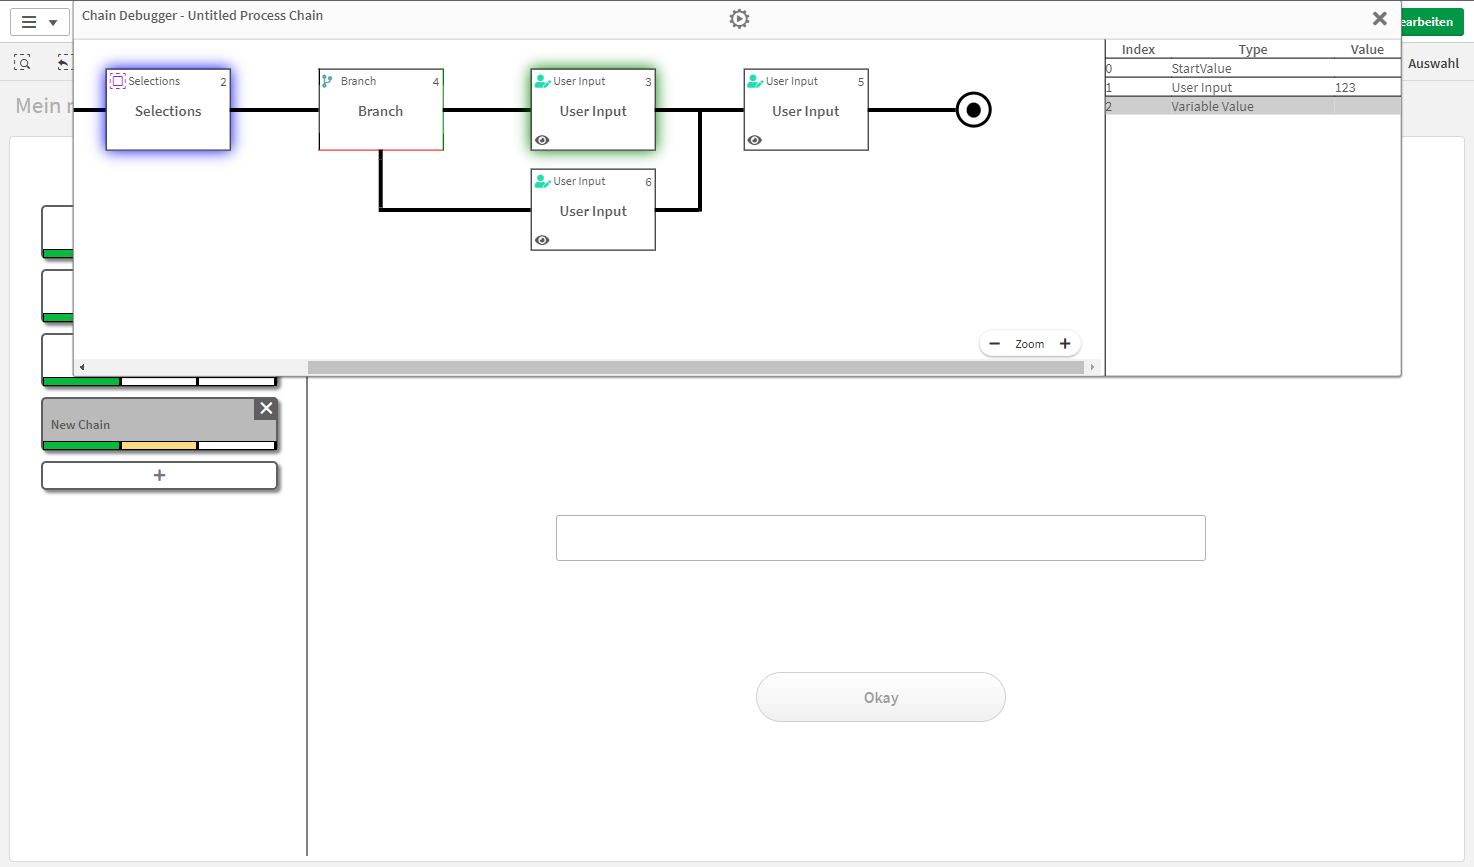
The debugger shows on the left side the current chain. The green highlighted step is the current Step. The Stepdata of each Step can be found in a list on the right side. When hovering the stepdata the coressponding step will be highlighted blue. While the debugger is in the standard mode you can interact with the processchain like always and see the evaluated values.
The StepByStep mode allows you to go through each step indivually (the First step sets the Startvalue and is not highlighted). After each step you press the green Next Step Button to view the results after this step.